

9 Essential SaaS Marketing Metrics to Boost Business Growth

Heading 1
Heading 2
Heading 3
Heading 4
Heading 5
Heading 6
Lorem ipsum dolor sit amet, consectetur adipiscing elit, sed do eiusmod tempor incididunt ut labore et dolore magna aliqua. Ut enim ad minim veniam, quis nostrud exercitation ullamco laboris nisi ut aliquip ex ea commodo consequat. Duis aute irure dolor in reprehenderit in voluptate velit esse cillum dolore eu fugiat nulla pariatur.
Block quote
Ordered list
- Item 1
- Item 2
- Item 3
Unordered list
- Item A
- Item B
- Item C
Bold text
Emphasis
Superscript
Subscript

9 Essential SaaS Marketing Metrics to Boost Business Growth
.png)
Harikrishna Kundariya
Join us on November 6th as Mr. Yash Mishra, Product Manager, Fatakpay, reveals the precise strategies that eliminates the speed trap and guarantees a 30% conversion boost.
According to Gartner, buyers now complete a little over 60% of the buying process before engaging with a vendor.
By 2026, data-driven approaches will replace gut feeling in 65% of B2B sales organisations. Knowing which metrics to track is what can make the difference between lasting growth and lagging growth. Most SaaS leaders track dozens of metrics; however, you only need nine essential ones.
These nine SaaS marketing metrics will tell you if your marketing is efficient, if your customers are happy, and if your business is scaling sustainably. We are going to discuss each of the metrics, how they are calculated, and what benchmarks you are aiming for.
What are SaaS Marketing Metrics?
SaaS marketing metrics are simple numbers that allow you to determine how well your marketing strategies are working. They monitor the performance and success of every effort you make to attract, convert, and retain customers. These data points give you a good idea of if your marketing strategies are working and where you can improve for better results.
Unlike traditional marketing metrics that only focus on things like awareness or engagement, SaaS marketing metrics link directly to revenue and the lifetime value of a customer. They show you the whole customer journey - from the first contact to renewal and expansion.
9 Important SaaS Marketing Metrics to Grow Business
These SaaS marketing metrics show what truly drives your growth. They help you spot what works and fix what slows you down. Track them closely, and turn data into smarter business decisions.
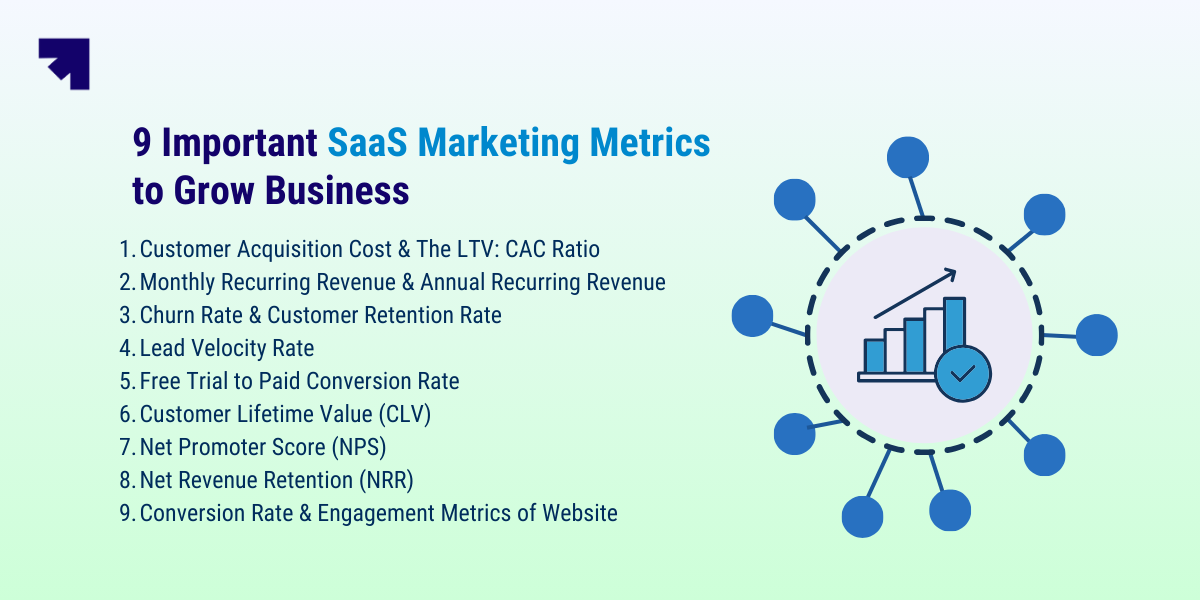
1. Customer Acquisition Cost & The LTV: CAC Ratio
CAC (Customer Acquisition Cost) is the total cost of acquiring a single paying customer that includes marketing costs, salaries of the sales team, advertising and promotional costs.
The formula is : CAC = Total acquisition costs Number of new customers
CAC in itself won't tell everything. You need to combine it with Customer Lifetime Value (CLV) to have a clear understanding of profitability.
For example, a customer acquisition cost of $500 would appear costly until the time you see that each customer brings in a revenue of $5,000. The LTV: CAC ratio tells you whether your acquisition strategy is generating profit or not.
The benchmark: Aim for a 3:1 LTV:CAC ratio - for every dollar spent to acquire a customer, he or she should create three dollars in lifetime value. Below 3:1 is an indicator of inefficient spending. A ratio that is above 3:1 indicates that you may not be investing enough for growth.
SaaS companies spend $2 to acquire every $1 of new customer revenue, which is an increase of 14% over the previous years.
Action step: Work out your CAC every month and compare it to your revenue retention. If CAC increases and retention decreases, maximize your acquisition channels.
2. Monthly Recurring Revenue & Annual Recurring Revenue
With regards to a SaaS business, these metrics are the heartbeat of the business. They demonstrate the predictability of revenue, guide decisions on who to hire, and determine whether you will be able to make it through rough periods. Unlike conventional businesses that have sporadic sales, SaaS benefits from the predictability of recurring revenue.
The formula is:
MRR = number of customers average monthly subscription price
ARR = MRR 12
MRR displays short-term health and month-to-month momentum. ARR gives investors and board members the big picture perspective.
The MRR growth rate should be monitored on a month-over-month basis. Healthy SaaS businesses aim for 3-5% monthly MRR growth. Less than 2% indicates poor marketing or retention problems.
Benchmark: Companies with $1M-$5M ARR median growth is 40% and $5M-$20M companies' growth is 30%. You should use these benchmarks as the basis for measuring whether your growth trajectory is in line with the performance of your peers.
Action step: Review MRR growth by segment and plan every month. Identify which tiers drive growth and which stall. Double down on the plans that show faster expansion and lower churn.
3. Churn Rate & Customer Retention Rate
Churn rate is the percentage of customers who cancel subscriptions in a given period of time. Retention rate is the percentage of customers who are willing to stay.
Reputation tends to suffer when there is a high churn rate. Even aggressive customer acquisition will fail to scale if churn is high. Retention cost is 5-7x less than acquisition.
Benchmarks:
- Mature SaaS enterprise: 5-7% annual churn
- Overall B2B SaaS market: 10-15% annual churn
- Monthly churn target: <1% mid-market & enterprise
- Best-in-class: 85-87% annual retention rate
The difference between these benchmarks is important. Enterprise companies with longer contracts have naturally low churn rates. Startups and SMB-focused products normally end up in the 10-15% range annually.
The formula is:
Monthly churn rate = (customers at the beginning of the month -customers at the end of the month)customer at the beginning of the month 100
Action Step: Monitor churn by cohort - group the customers by the month of signing up so that we can identify the most loyal ones. This reveals if the customers in recent months are stickier or whether retention is affected by product changes.
4. Lead Velocity Rate
Lead Velocity Rate (LVR) measures the qualified leads that you receive each month. It shows month-over-month growth of leads that fit your ideal customer and want to buy.
The formula is:
LVR: (Qualified leads this month- Qualified leads last month) Qualified leads last month 100
LVR is an indicator of future revenue. While MRR and ARR show what happened, LVR shows what’s coming. If LVR remains positive and grows, you can anticipate an increase in revenue 1-2 quarters in advance.
Benchmark:
- Healthier growth stage SaaS: 10-15% LVR per month
- High-growth SaaS: 20%+ monthly LVR
- Mature SaaS: 5-10% monthly LVR
A failing LVR indicates issues with your marketing even before you lose revenue. If LVR has dropped for two months, consequently, audit your lead generation, content and qualification rules.
Action Step: Measure LVR for each channel. If organic search gives 15% LVR and paid ads give 5%, then shift the budget. Review qualification rules on a quarterly basis in order to only count actual sales-ready prospects, and not just anyone who fills out a form
5. Free Trial to Paid Conversion Rate
This number indicates what percentage of trial users end up paying customers. For product-led growth SaaS, it is often the most important metric as it measures how well the product is living up to promises.
The formula is:
Free Trial to Paid Conversion = (Trial users who paid Total trial sign-ups)100
The rate lets you know whether marketing is drawing in the right people and whether the product is delivering. A low rate with a large number of sign-ups indicates that marketing and products are out of sync.
Benchmark:
- SaaS average: 2-5% self serve trial
- Strong Saas: 10-15%
- Best-in-class with guided onboarding: 20-25%
- Enterprise trials with sales: 30-40%
Track rate by trial length. You want the lime long enough for the users to see the value, but not so long that they will lose interest. Most firms use a 14-day trial, enterprise products may require 30 days.
Action step: Segment conversion rates by channel, company size, and user behavior during trial. Users who hit milestones (e.g., connect integrations, invite teammates) convert 3-5 times faster. Find these activation events and make the trial better around them. Send targeted emails on days 3, 7, and 12, showcasing features that match the user’s activity.
6. Customer Lifetime Value (CLV)
CLV is the total amount of revenue that you expect from a single customer during the course of your complete relationship.
The formula is:
CLV= average monthly subscription price average customer lifespan in months
That means, if a customer pays $100/month and stays for 10 months, then his/her CLV is $1,000. This matters in the case of customer acquisition spending, where CLV sets the limit. If CLV is $1,000, spending $4,000 per customer is not sustainable.
How to improve CLV:
- Extend customer lifetime (minimize churn)
- Increase the price of the monthly subscription
- Improve expansion revenue through upsells
Most SaaS leaders only focus on churn reduction. But raising a price or pushing up upsells can often lead to an impact on CLV quicker than a reduction in churn alone.
Let's take an example here. A company has 100 customers that pay a monthly charge of $50 over the period of 2 years; this company has a CLV of $1,200. By increasing the period to 3 years with improved onboarding, CLV increases to $1,800, which is a 50% increase with zero pricing changes.
Action step: Calculate CLV by customer segment and acquisition channel. If a segment shows low CLV, adjust pricing, onboarding, or upsell paths for that group.
7. Net Promoter Score (NPS)
NPS is a measure of whether or not your customer will recommend your product. To understand who are your promoters or detractors we can ask questions like: How likely you will recommend our product or services on the scale of 0-10?
How to calculate:
- Promoters (9-10): Customers who are loyal and recommend you
- Passives (7-8) Satisfied but not enthusiastic
- Detractors (0-6): Dissatisfied customers
NPS = (% of promoters)-(% of detractors)
The benchmarks:
- Median SaaS NPS: 36
- Strong B2B SaaS: 39-76
- Exceptional: Above 50
- World-class: Above 80
This is important because NPS is associated with growth. Companies with better NPS have less churn, higher expansion revenues, and better viral adoption.
Action step: Survey 50+ customers every quarter. Track NPS trends over time. Even 5-point improvements each year are significant and meaningful improvements.
8. Net Revenue Retention (NRR)
NRR is a measure of whether your existing customer base grows or shrinks in terms of dollar value, considering churn, downgrades, upgrades, and expansions.
The formula is:
(revenue at period end +expansion revenue - churn revenue) revenue at period start 100
NRR tells you if you’re winning with your existing customers. An NRR of 101% indicates expansion revenue greater than churn, which is a sign of product-market fit.
Today, the median NRR is at 101 %. While this is positive, it indicates that it’s becoming harder and harder to retain and grow existing customers. So, companies are becoming more selective about add-ons and upgrades, which makes expanding ARR more difficult.
Benchmark:
- Healthy SaaS: 110% NRR
- Strong SaaS: 130%+ NRR
- Struggling SaaS: <100% NRR
An NRR of more than 110% NRR indicates that your product not only gets stickier with time but actually becomes more valuable.
Action step: Create a monthly NRR dashboard that highlights revenue at risk and revenue potential. Flag accounts with declining usage or skipped logins as churn risk. Flag accounts hitting feature or seat limits as growth-ready. Prioritize outreach based on these signals, not just contract dates.
9. Conversion Rate & Engagement Metrics of Website
Conversion rate measures the percentage of website visitors taking a desired action - signing up for a trial, requesting a demo or purchasing.
Let's be clear here. Unlimited traffic cannot do anything with low conversion rates. A 2% conversion rate compared to 5% yields a significantly different ROI for the same amount of traffic.
The metric to track:
- Overall site conversion rate
- Conversion rated for page-specific
- Bounce rate
- Average session duration
- Engagement data (time on page, scroll depth, CTA clicks)
Traffic volume is not that significant in 2026; what is significant is engaged traffic volume. Visitors who spend 3+ minutes on your site convert 5 times more than those who spend 30 seconds.
Action step: Use software such as Hotjar or Session Replay to observe the behavior of visitors. Are they clicking CTAs? Scrolling through prices? This leads to optimization activities.
Putting it All Together
These nine SaaS marketing metrics should be in a single dashboard that you can look at weekly. Here’s how they are interconnected:
- Poor CAC + Low churn + High NRR = Scalable Growth
- High CAC + High churn + Low NPS = Red flag
- Low CAC + Low churn + High NRR + Improving NPS = Competitive advantage
The mistake most SaaS leaders make is optimizing metrics in isolation. Reducing CAC and not taking into account NPS could result in the acquisition of the wrong customer. Enhancing NPS without managing churn implies that you are trying to please already dissatisfied customers.
Conclusion
SaaS metrics are more than spreadsheets; they are the conversation between your business and your customers. CAC lets you know whether or not your message resonates. Through churn, we can see product problems. NRR displays whether you are expanding value or not. NPS reflects whether or not customers actually believe in your solution.
So the real question is simple. Do you want to spend time building reports, or using them to drive revenue?
This is where platforms like Corefactors CRM fit naturally into the process. By bringing sales, marketing, and customer data into a single CRM and RevOps framework, teams get clearer visibility into pipeline performance, campaign outcomes, and customer activity in one place. Instead of spending hours pulling reports, revenue teams can focus on improving execution, refining strategy, and building predictable growth based on reliable data.
Heading 1
Heading 2
Heading 3
Heading 4
Heading 5
Heading 6
Lorem ipsum dolor sit amet, consectetur adipiscing elit, sed do eiusmod tempor incididunt ut labore et dolore magna aliqua. Ut enim ad minim veniam, quis nostrud exercitation ullamco laboris nisi ut aliquip ex ea commodo consequat. Duis aute irure dolor in reprehenderit in voluptate velit esse cillum dolore eu fugiat nulla pariatur.
Block quote
Ordered list
- Item 1
- Item 2
- Item 3
Unordered list
- Item A
- Item B
- Item C
Bold text
Emphasis
Superscript
Subscript
Frequently Asked Questions (FAQs)
What is the difference between SaaS marketing metrics and sales metrics?


SaaS marketing metrics examine the early stages of a customer's journey. They measure how well you are able to bring in new people, keep them interested, and become qualified leads or trial users. Sales metrics are focused on the latter parts and how fast those leads go through the sales process to become paying customers. In product-led growth, the lines between marketing and sales are not as clear because marketing often helps customers all the way to the point of buying.
How frequently should I examine my SaaS marketing metrics?
Check MRR, churn rate, and velocity rate of leads every week so that you can spot trends early. Look at CAC, CLV, and conversion rates once a month because you need more data to see real patterns. Every quarter, dive deep into data from the NPS and any customer cohort to understand trends in the longer term.
What is a realistic CAC payback for early stage SaaS companies?
For early-stage B2B SaaS, most investors are interested in a CAC payback of 12-18 months. That means you recover the cost of acquiring a customer in a year and a half of their subscription revenue. Enterprise SaaS with longer sales cycles may have a payback time of 18-24 months, while self-serve products should have a payback time of 6-12 months. If your payback period is greater than 24 months, then you're likely either paying too much when acquiring or you're charging too little.
Is it possible to have good MRR growth but still be in trouble?
Yes. MRR growth may look good on paper, but if it's all because the company is adding new customers while existing ones continue to leave, you are building on shaky ground. That's why you need Net Revenue Retention alongside MRR. A company that grows MRR by 10% each month but loses 15% of customers each month is hiding serious retention problems behind aggressive spending on acquisition - an unsustainable approach that will collapse when acquisition costs rise, or budgets shrink.
Should I focus on reducing churn or on increasing conversion rates?
For most SaaS companies, churn reduction leads to more rapid ROI because retaining existing customers costs 5-7x less than customer acquisition. A 1% decrease in monthly churn can increase company value by 12% or more. If your churn rate is already below 5% a year, then working on the conversion rate might yield better results. Decide by taking a look at where you have the greatest area of improvement: see what revenue impact you'd get with just a 1% reduction in churn or a 1% increase in conversion if you work with your current numbers.


.png)


.png)