.svg)
Thank you! Your submission has been received!
Oops! Something went wrong while submitting the form.
Get a clear view of your sales performance with a flexible reporting dashboard built to help teams analyze leads, conversions, pipeline, revenue and make better decisions faster.


.png)


See what is happening across the sales funnel in real time. From lead sources to revenue trends, everything you need is in one place.

Drill down to the exact leads that make up that number
See distribution across your pipeline at a glance
Identify where deals stall and where your best reps shine.
.webp)
Monitor the full journey of leads across stages. Understand where deals advance — and where they drop off.
Real-time insight into pipeline health. Reduce uncertainty and forecast revenue with confidence.
Uncover stage delays and performance gaps across your entire sales funnel.
Spot slow stages and identify agents or processes causing delays.
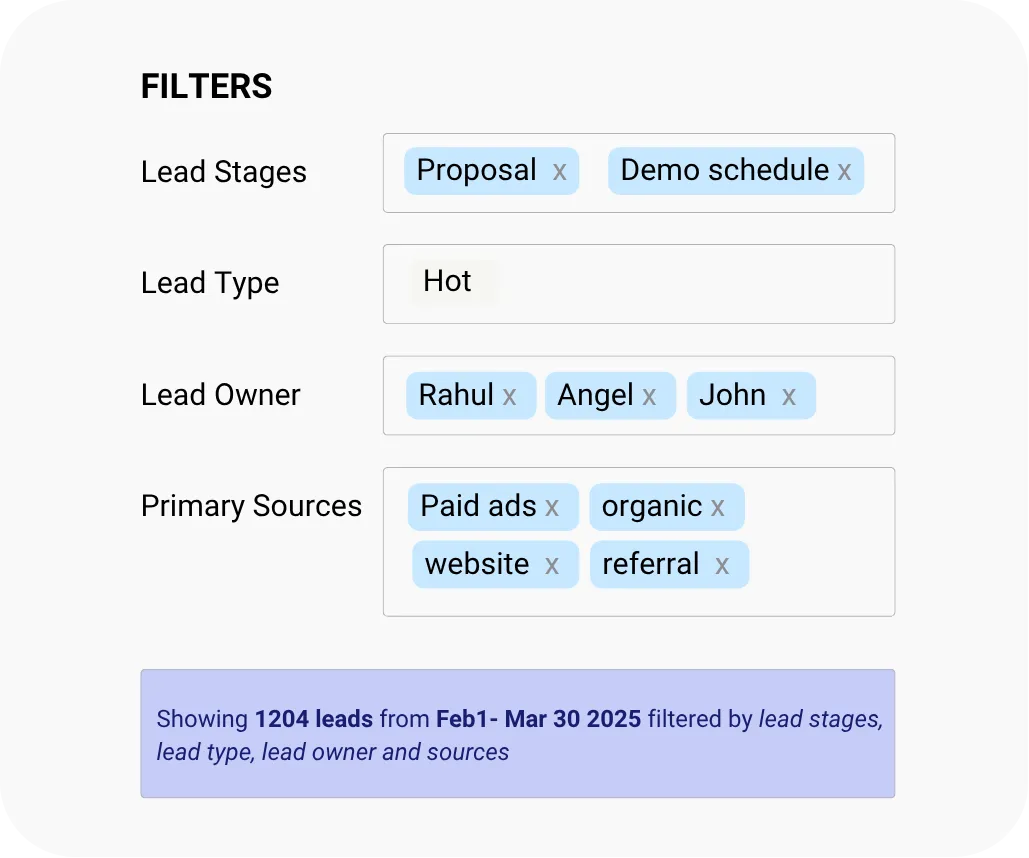
Quick filters let you define exactly what you're analyzing — by time, by date type, and by any field in your CRM. No guesswork, no noise.
Filter by today, this week, this month, this quarter, or any custom date range you need.
Choose whether to filter by lead creation date, or last activity date.
Apply filters on any field in your CRM standard or custom for laser focused analysis.

Break down your entire lead report by any field in your CRM.
Get answers to the questions that actually drive strategy.
Harness the power of AI to analyze every customer interaction across your dealer group.
Who is converting the most?
Which channel brings the best ROI ?
What category of lead closes fastest?
How are deals being closed?
Where is revenue concentrated?
Which segments perform best?
What are customers buying?
Any field you've created in your CRM.
Tabular precision meets visual clarity. Every chart is clickable, revealing
the leads and deals behind each data point.
Lending heads and branch managers can track every application and bottleneck in real time,
without waiting for manual Excel consolidation.
Whether you run a B2B sales team, a high-volume B2C operation, or a service business and whether you're a rep, manager, or leader the dashboard adapts to you.
Every field, stage, metric, and filter is customizable — so the dashboard reflects how your business actually works.
Sales reps, managers, and leaders each need different answers. The dashboard surfaces the right data for each.

Tabular precision meets visual clarity. Every chart is clickable, revealing
the leads and deals behind each data point.
.png)


.png)